1H NMR shows excellent promise to be utilized in the quality control and authentication of essential oils. In order to ascertain if benchtop NMR systems reveal adequate “1H spectral fingerprints” for this purpose we have run several hundred essential oils at 300 MHz (Varian Mercury-300 MVX by 1H, 13C, COSY, HETCOR, DEPT) as well as at 82.3 MHz (Picospin 80), 60 MHz (Aspect-60), and 42.5 MHz (Magritek Spinsolve). The results plainly show that the spectrometers all yield similar proton line-widths with the difference in field strength leading to different levels of spectral dispersion and resolution. Though each spectrum is different it can plainly be seen that they all contain the same information with varying degrees of overlap. Chemometric and database comparative methods are being developed to allow identification of various essential oils as well as screening and quantifying different levels of adulteration. The figures below show examples from 6 different essential oils showing spectra obtained from all 4 spectrometers and plotted in the normalized chemical shift scale (ppm) as well as the absolute frequency scale (Hz).


Polyalphaolefin Hydrogenation – Residual Olefin Analysis – 1H NMR versus Bromine Number
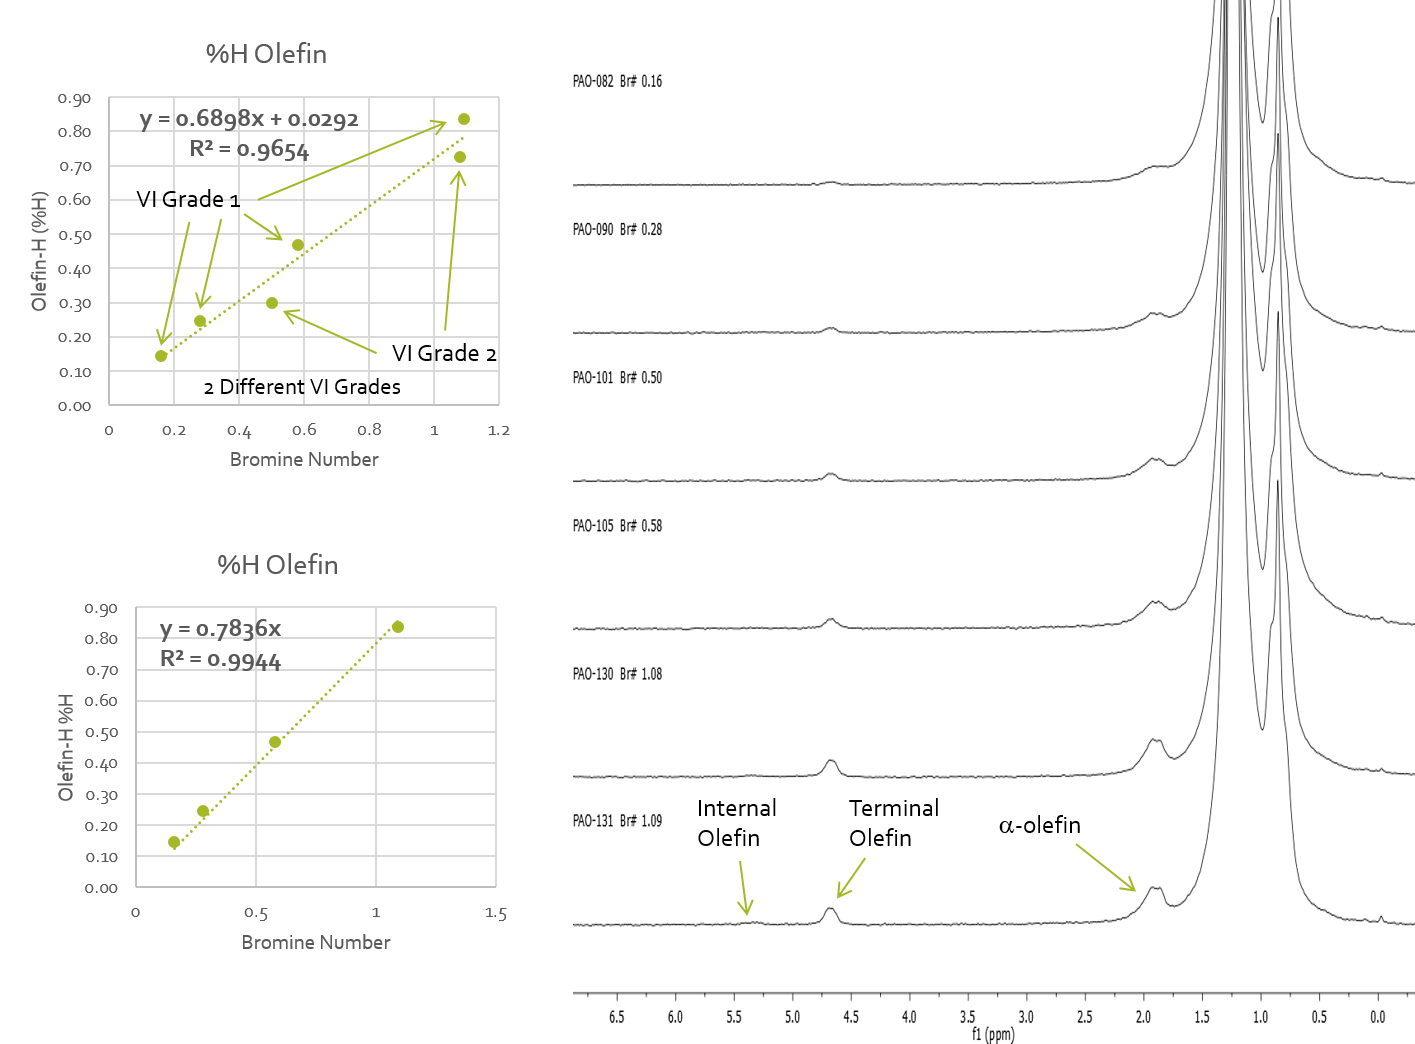
1H NMR is an excellent tool for monitoring the residual olefin content of polymers after hydrogenation reactions. The fact that the olefin fall in a unique region of the spectrum means that it is a straightforward measurement to quantify the %H present as olefin or to correlate that olefin content with other analyses such as bromine number. Here is an example of a polyalphaolefin residual olefin analysis. The olefin proton content (%H) was plotted against bromine number values obtained on each of the samples. A linear correlation was obtain but two different correlations were observed that were dependent on the viscosity index of the polyalphaolefin being analyzed. Figure 1 shows the 1H NMR spectra obtained on neat samples on a Picospin-80 spectrometer operating at 82.3 MHz. The methyl and methlene protons of the polymer backbone are plainly seen and the olefin and alpha-olefin protons are observed.
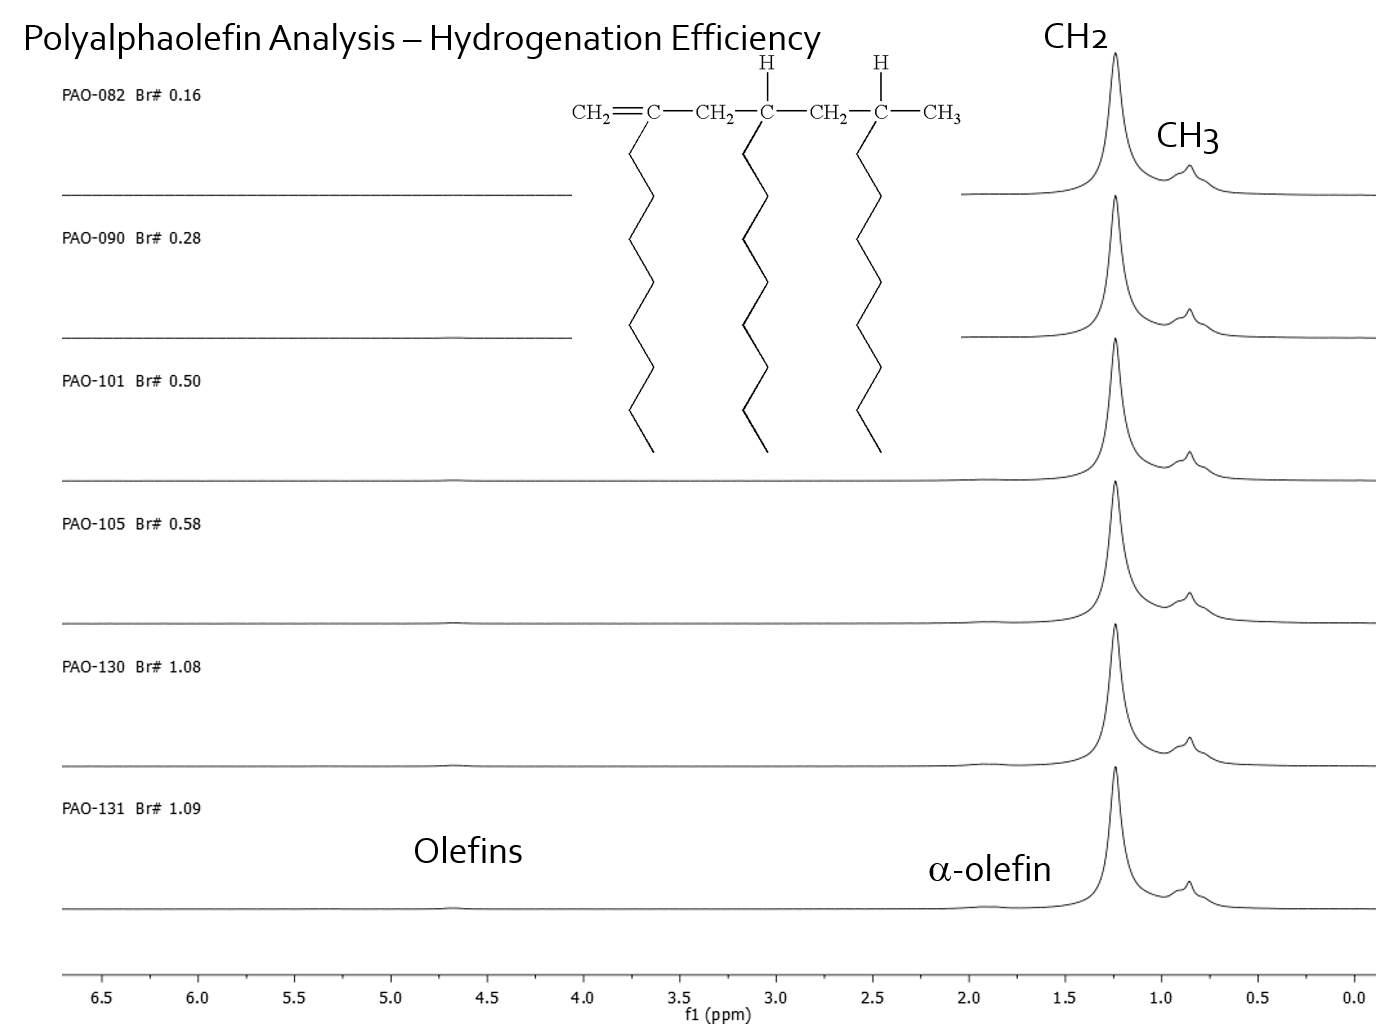
Figure 2 shows the linear correlation between %H olefin and bromine number with the two correlations caused by different VI grade being indicated. The analysis shows that for the two viscosity grades the grade can be identified from the linear correlation that the data falls onto and the %H olefins content can directly yield the bromine number. This NMR method provides an alternative to the following ASTM standards: D1159 Test Method for Bromine Numbers of Petroleum Distillates and Commercial Aliphatic Olefins by Electrometric Titration D1491 Test Method for Test for Bromine Index of Aromatic Hydrocarbons by Potentiometric Titration D1492 Standard Test Method for Bromine Index of Aromatic Hydrocarbons by Coulometric Titration D2710 Test Method for Bromine Index of Petroleum Hydrocarbons by Electrometric Titration D5776 Test Method for Bromine Index of Aromatic Hydrocarbons by Electrometric Titration
NMR Detection of Tomato Paste Spoilage in 1000 Liter Metal Lined Totes
Poster to be Presented at the 56th ENC, Asilomar CA, April 2015
| NMR Detection of Tomato Paste Spoilage in 1,000 L, Metal Lined Totes |
| Michele Martin1; Paul Giammatteo2; Michael McCarthy1; Matthew Augustine1 |
| 1University of California, Davis, Davis, California; 2Process NMR Associates, Danbury, CT |
| Abstract Low field nuclear magnetic resonance (NMR) is used as a non-invasive method for detecting spoiled tomato paste. It is shown that the 1H T1 and T2 relaxation times change as tomato paste spoils due to changes in viscosity and/or changes in the concentration of paramagnetic compounds. With the goal of developing a spoilage detector that can be used in a tomato processing facility, a γBo = 19.5 MHz single-sided handheld NMR instrument is used. Due to the dominance of diffusion on relaxation measurements made with the single sided instrument, the slope of the amplitude of a spin echo for three different delay times is used to provide a viscosity dependent parameter that permits the differentiation between pristine and spoiled tomatoes. 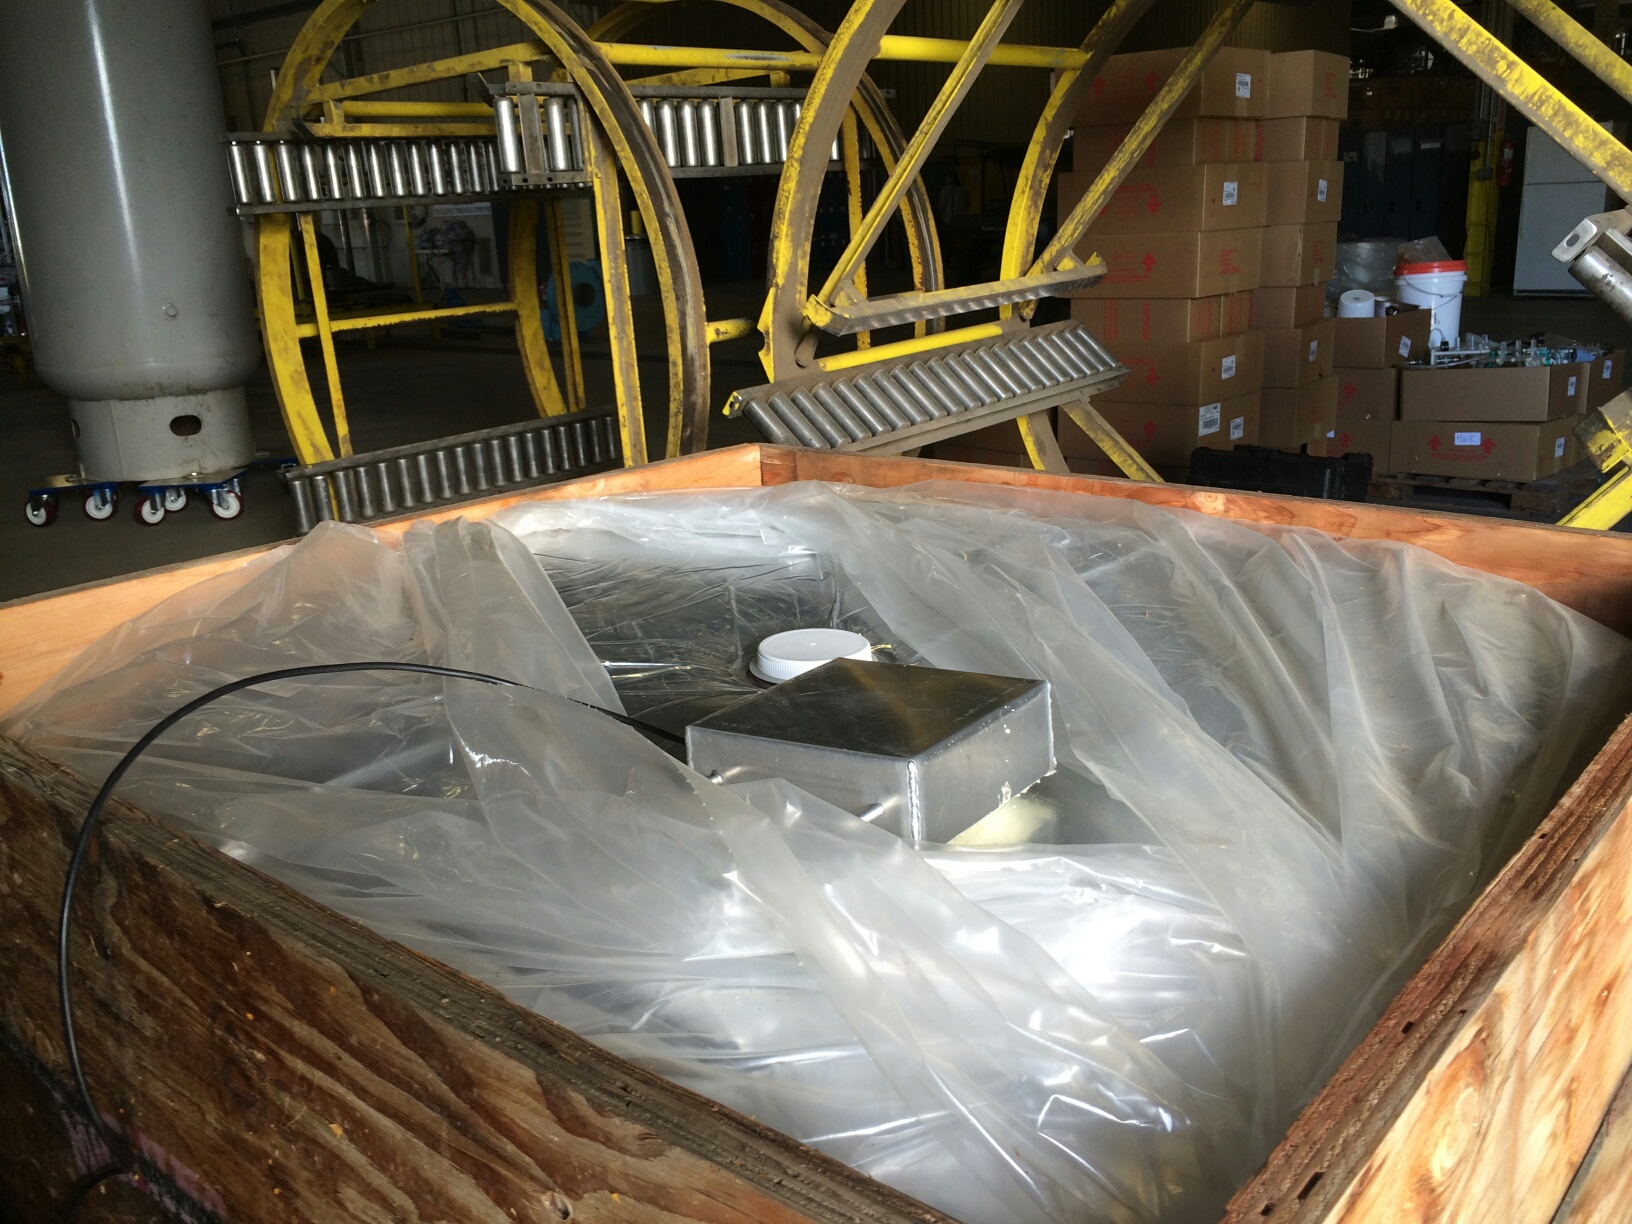 |
One-Sided NMR – Non-Invasive Analysis of Tomato Paste